Thoughts on the Minimum Wage Part 1
Introduction
The debate over what the minimum wage should be is one that has raged on for a long time. This is ultimately a normative question, and one that’s unlikely to ever be solved to everyone’s satisfaction; however, my interest lies in understanding the minimum wage’s effective purchasing power. It seems that most of these arguments that pop up among those of us who aren’t economists almost never consider the effects of inflation outside of a general hand wave towards the idea that the dollar held more value in the past and therefore we should absolutely raise the minimum wage to $X immediately before the dollar decreases in value some more.
Those against an increase in the minimum wage talk about how raising the minimum wage will increase the cost of living, but this increase is much lesss dramatic than may be expected, coming in under a 1% increase per 10% increase in minimum wage.
With this in mind, my goal with this small project is to look at two specific ideas:
- What does the minimum wage look like if we use cumulative CPI changes to adjust each year to the most current year in our dataset?
- What does the minimum wage look like if we use cumulative CPI changes excluding deflationary periods to adjust each year to the most current year in our dataset?
Gathering the Data
Library Packages
We’ll start by loading the packages that we will use in our analysis.
library(tidyverse)
library(ggplot2)
library(rvest)
library(zoo)
Webscrape Minneapolis Fed
Our first set of data is scraped from the Minneapolis Fed. Their website has a table of CPI-U changes by year going all the way back to 1913. This will cover the entire period that minimum wage laws have existed in the United States.
url_data <- "https://www.minneapolisfed.org/about-us/monetary-policy/inflation-calculator/consumer-price-index-1913-"
css_selector <- ".i9-e-table__container > table:nth-child(1)"

minfeddata <- url_data %>%
  read_html() %>%
  html_node(css = css_selector) %>%
  html_table() %>%
  as.data.frame()

minfeddata <- minfeddata %>%
  rename(
    year = Year,
    an.avg = `Annual Average`,
    an.pct.chg = `Annual Percent Change
            (rate of inflation)`
    )

minfeddata$an.pct.chg <- as.numeric(gsub("\\%", "", minfeddata$an.pct.chg))
Webscrape Department of Labor
Our data regarding federal minimum wage levels is pulled from the Department of Labor. For this project the 1938 Act will be the act that is used in the analysis. While the 1938 act only covers certain types of employees (specifically employees engaged in interstate commerce) but for this analysis will be sufficient.
url_data <- "https://www.dol.gov/agencies/whd/minimum-wage/history/chart#fn1"
css_selector <- "table"

doldata <- url_data %>%
  read_html() %>%
  html_node(css = css_selector) %>%
  html_table() %>%
  as.data.frame()

doldata <- doldata %>%
  rename(
    date = `Effective Date`,
    act1938 = `1938 Act  1`,
    amend1961 = `1961 Amendments  2`,
    amend1966 = `1966 and Subsequent
			Amendments  3`
    )

doldata <- separate(data = doldata,
                    col = date,
                    into = c("date", "year"),
                    sep = "\\,")
doldata$year <- gsub(" ", "", doldata$year)
doldata$year <- substr(doldata$year, 1, 4)

doldata <- separate(data = doldata,
                    col = act1938,
                    into = c("act1938", "garbage"), sep = " ")

doldata$act1938 <- gsub("\\$", "", doldata$act1938)
doldata$act1938 <- as.numeric(doldata$act1938)

doldata$increaseyear <- ifelse(!is.na(doldata$act1938), TRUE, FALSE)

head(doldata)
##     date year act1938 garbage amend1961 amend1966 increaseyear
## 1 Oct 24 1938    0.25    <NA>                             TRUE
## 2 Oct 24 1939    0.30    <NA>                             TRUE
## 3 Oct 24 1945    0.40    <NA>                             TRUE
## 4 Jan 25 1950    0.75    <NA>                             TRUE
## 5  Mar 1 1956    1.00    <NA>                             TRUE
## 6  Sep 3 1961    1.15    <NA>     $1.00                   TRUE
Data Cleaning
Since our data from the DOL is listed only for select year and does not does not have a value for each year like the Minneapolis Fed data, we can clean the date information to only include the ‘Year’ to only contain years instead of the month and year. Next the data is attached to the Minneapolis Fed data, and years without minimum wage increases will have the previous value added for that year. If the minimum wage increased during a year, a final column will record that year as an increase year, which will improve the graphical output later on.
analysis <- merge(minfeddata[ , c("year", "an.pct.chg")],
                  doldata[ , c("year", "act1938", "increaseyear")],
                  by = "year",
                  all.x = TRUE,
                  all.y = TRUE)

analysis$increaseyear <- ifelse(is.na(analysis$increaseyear),
                                FALSE,
                                analysis$increaseyear)

analysis$increaseyear <- as.factor(analysis$increaseyear)

# To allow for correct imputation.
analysis$act1938[1] <- 0

# To impute minimum wage values using last observation carried forward.
analysis$act1938 <- na.locf(analysis$act1938)

head(analysis)
##   year an.pct.chg act1938 increaseyear
## 1 1913         NA       0        FALSE
## 2 1914        1.3       0        FALSE
## 3 1915        0.9       0        FALSE
## 4 1916        7.7       0        FALSE
## 5 1917       17.8       0        FALSE
## 6 1918       17.3       0        FALSE
Question 1
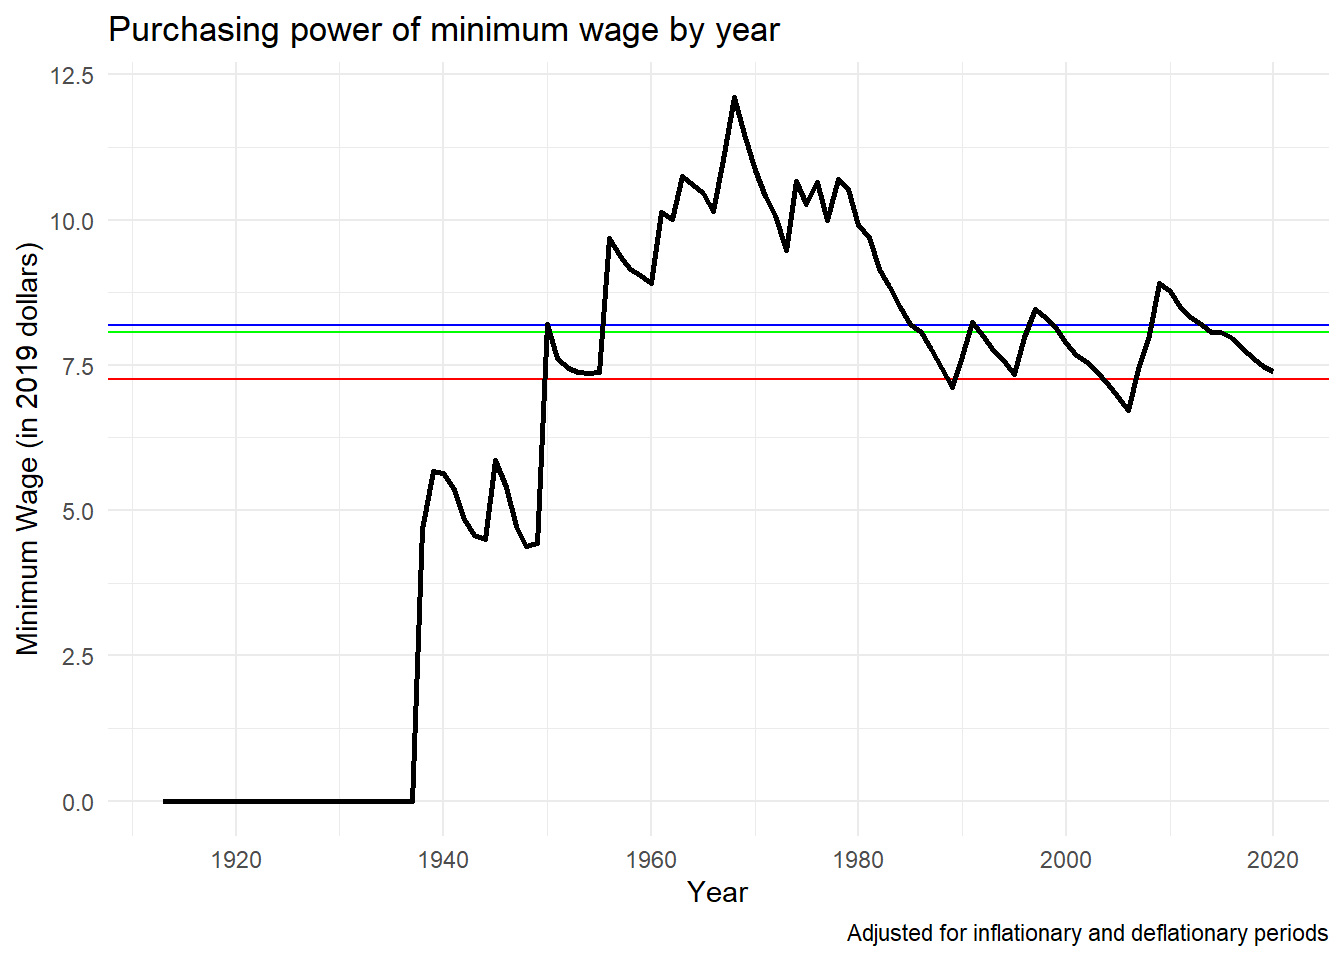
As a refresher, the goal for this is to view minimum wage amounts for each year in current dollar values, adjusted for both inflationary and deflationary periods. This would be indicative of a minimum wage that was tied to CPI-U.
Calculate minimum wage values for each year inflated to 2019 values.
To get our minimum wage amounts, a for loop iterates through each row in our dataset, then another for loop multiplies each year’s minimum wage value by each successive year’s percent change in inflation, passing the final value out to a list. Once these calculations are complete, the inflated minimum wage is appended to the analysis dataset.
output <- c()

for (row in 1:(nrow(analysis))){
   amount <- analysis$act1938[row]
   for (line in (row + 1):nrow(analysis)) {
      amount <- amount * (1 + (analysis$an.pct.chg[line]/100))
   }
   output <- append(output, amount)
}

analysis$adjval <- round(output, 2)
analysis$year <- as.Date(ISOdate(analysis$year, 1, 1))
Graph Inflated Minimum Wage
There are 3 reference lines in the graph below. Green represents the median minimum wage of $8.06, Red represents the current minimum wage of $7.25, and Blue represents the average minimum wage of $8.19. Note that average and median values are excluding the years in which a minimum wage did not exist.
minwage = 7.25
avgminwage = mean(analysis$adjval[26:108])
medianminwage = median(analysis$adjval[26:108])

print(paste("The average minimum wage was:", round(avgminwage, 2)))
## [1] "The average minimum wage was: 8.19"
print(paste("The median minimum wage was:", round(medianminwage, 2)))
## [1] "The median minimum wage was: 8.06"
baseplot <- ggplot(data = analysis) +
  theme_minimal() +
  aes(x=year, y=adjval) +
  geom_line(size=1) +
  ggtitle("Purchasing power of minimum wage by year") +
  xlab("Year") +
  ylab("Minimum Wage (in 2019 dollars)") +
  labs(caption = "Adjusted for inflationary and deflationary periods")

refplot <- baseplot +
  geom_hline(yintercept = minwage, color = "red", show.legend = TRUE) +
  geom_hline(yintercept = avgminwage, color = "blue") +
  geom_hline(yintercept = medianminwage, color = "green") +
  geom_line(size=1)


refplot
Question 2
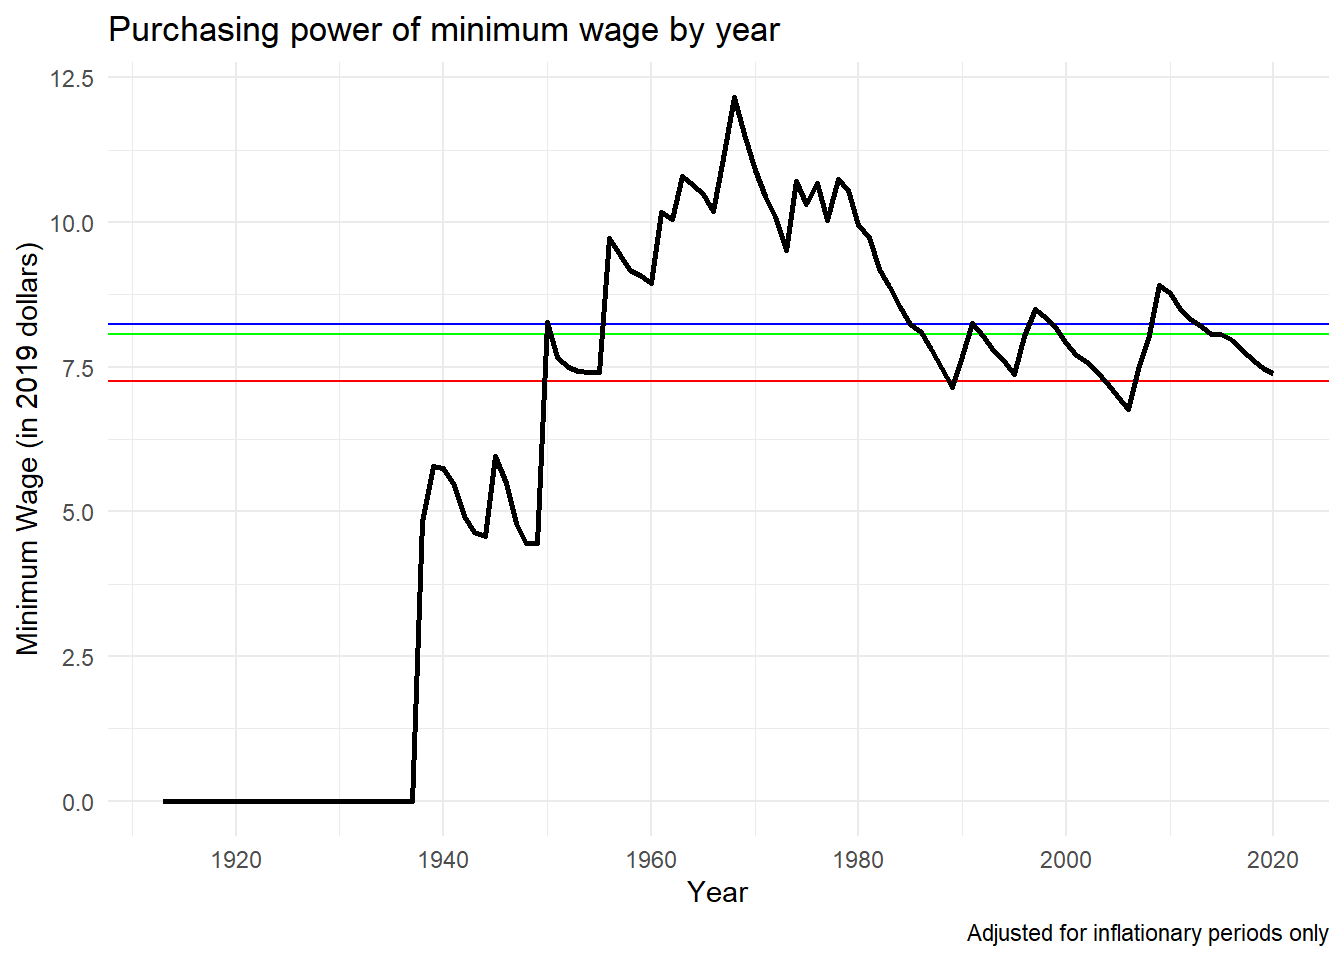
As a refresher, the goal for this is to view minimum wage amounts for each year in current dollar values, adjusted only for inflationary periods. This would be indicative of a minimum wage that was tied to CPI-U, but more realistically only tied to the index when it increases, as most individuals would not be amenable to minimum wages decreasing resulting in a lower income.
Calculate minimum wage values for each year inflated to 2019 values.
To get our minimum wage amounts, a for loop iterates through each row in our dataset, then another for loop multiplies each year’s minimum wage value by each successive year’s percent change in inflation, passing the final value out to a list. However this time an if statement is introduced, which multiplies the increase only if the change in CPI is positive. Values that would result in a decrease are ignored. Once these calculations are complete, the inflated minimum wage is appended to the analysis dataset.
analysis$inflation <- ifelse(analysis$an.pct.chg >= 0, analysis$an.pct.chg, 0)

output <- c()

for (row in 1:nrow(analysis)){
  amount <- analysis$act1938[row]
  for (line in (row + 1):nrow(analysis)) {
      amount <- amount * (1 + (analysis$inflation[line]/100))
  }
  output <- append(output, amount)
}

analysis$adjval2 <- round(output, 2)
Graph Inflated Minimum Wage
There are 3 reference lines in the graph below. Green represents the median minimum wage of $8.07, Red represents the current minimum wage of $7.25, and Blue represents the average minimum wage of $8.23. Note that average and median values are excluding the years in which a minimum wage did not exist.
avgminwage2 = mean(analysis$adjval2[26:108])
medianminwage2 = median(analysis$adjval2[26:108])

print(paste("The average minimum wage was:", round(avgminwage2, 2)))
## [1] "The average minimum wage was: 8.23"
print(paste("The median minimum wage was:", round(medianminwage2, 2)))
## [1] "The median minimum wage was: 8.07"
baseplot2 <- ggplot(data = analysis) +
  theme_minimal() +
  aes(x=year, y=adjval2) +
  geom_line(size=1) +
  ggtitle("Purchasing power of minimum wage by year") +
  xlab("Year") +
  ylab("Minimum Wage (in 2019 dollars)") +
  labs(caption = "Adjusted for inflationary periods only")

refplot2 <- baseplot2 +
  geom_hline(yintercept = minwage, color = "red", show.legend = TRUE) +
  geom_hline(yintercept = avgminwage2, color = "blue") +
  geom_hline(yintercept = medianminwage2, color = "green") +
  geom_line(size=1)


refplot2
Observations
Interestingly enough, removing the deflationary periods did not result in a major change to the average or median values. Just to be sure we didn’t miss any interesting observations, let’s look at a summary of our two adjusted values.
rbind(summary(analysis$adjval), summary(analysis$adjval2))
##      Min. 1st Qu. Median     Mean 3rd Qu.  Max. NA's
## [1,]    0  4.4825  7.610 6.295926  8.9100 12.11    1
## [2,]    0  4.5425  7.635 6.325926  8.9175 12.16    1
Note that the median and mean are including zeros, hence the differences from the calculated values above. Finally, let’s calculate a differences column in cases there are large variances that are netting out in the long term. Large variances wouldn’t be acceptable in the short term (especially in a down market).
analysis$variance <- analysis$adjval2 - analysis$adjval

summary(analysis$variance)
##    Min. 1st Qu.  Median    Mean 3rd Qu.    Max.    NA's
##    0.00    0.00    0.03    0.03    0.04    0.15       1
The maximum variance of $0.15 accumulates to a $6 dollar difference over a 40 hour work week, which is not a major hit for most workers.
Final Thoughts
So what is a reasonable minimum wage? Using only historical analysis, one could make the argument that on average the minimum wage held a buying power of roughly $8.20. Yet for a time, the minimum wage had a buying power of $12.16, and this may represent a better target for us to shoot for, as at one point in time the government (and by extension the people) believed that this was a reasonable minimum wage. At no point in the history of the minimum wage did we stop and say “Wait, we’ve gone too far let’s lower the minimum wage.”
Another question that needs to be examined is how much of a burden increasing the minimum wage at the federal level would play on the states. Without considering the power of a dollar at the state (or even the county level) getting an accurate idea of what the minimum wage should be is again incredibly difficult. The minimum wage is inherently higher in Mississippi (the lowest cost of living state in the US) than Hawaii (with the highest cost of living). Is it inherently fair or equitable to have the same minimum wage?
I think I’ll have to work on this more in part two of this article, where we can dig into the minimum wage by state to see what we’re really up against.
Lucas Forrest
CPA
My interests include data analytics, machine learning, and oddball computer projects.