Plotting Stock Portfolio Risk versus Return in Python
For my first weekend project, I decided that I wanted to work through a portfolio project write up that was hosted over at Data Blogger. This project uses Python to plot stocks based on expected return and risk.
While this project was originally intended to be a simple copy the code and run sort of project, it quickly became more complicated when I ran the code and discovered that Google now blocks automated requests for financial data. This led me to do some research on a different method for pulling the financial data I needed for this project.
I found Alpha Vantage, a website that offers free API access to the data this project needed and set to work integrating it in place of the original code. There were a few hiccups, and I ended up asking my friend Kevin for some help, together we managed to get it working.
The first part of the code includes comments for documentation, which I like to use because over the course of projects like this I find myself opening 800 tabs and losing the one tab I actually care about that has the documentation info. Next we import all of the relevant libraries needed for the program. Note import pandas_datareader as web from the original write up isn’t present, instead, it was replaced by import alpha_vantage so we can use Alpha Vantage’s data instead of pulling data from Google Finance.
It was also necessary to specify that I wanted the TimeSeries data from the Alpha Vantage library because it is also possible to pull other data sets such as Cryptocurrency data, something I may look into working with later (This exact project could be modified relatively quickly to produce the same sort of output for cryptocurrency).
# Basic project outline: https://www.data-blogger.com/2017/06/08/make-a-profitable-portfolio-with-python/
# Alpha Vantage module documentation: https://github.com/RomelTorres/alpha_vantage
# Alpha Vantage API documentation: https://www.alphavantage.co/documentation/
# Pandas documentation: https://pandas.pydata.org/pandas-docs/stable/index.html
import alpha_vantage # Replaced panda_datareader
from alpha_vantage.timeseries import TimeSeries
import pandas as pd
pd.core.common.is_list_like = pd.api.types.is_list_like
import datetime
import os
import matplotlib.pyplot as plt
This next piece of code is pulled directly from the original project, it’s purpose is to create a folder called stocks for the program to store downloaded csv files.
The if not os.path.exists(stock_path): command checks if the “Stocks” folder exists. If it does, os.path.exists(stock_path) returns the statement “True”, which not then changes to a “False” statement, telling Python to skip creating the folder.
# Bootstrap the folder in which we will store the stocks
stock_path = 'stocks'
if not os.path.exists(stock_path):
    os.makedirs(stock_path)
Now comes the big change to the program, with special thanks to Kevin who helped me get everything working right. Alpha Vantage doesn’t let the user input more than one stock symbol at a time, something that the old method did allow. The first change was to add an input section to allow the user to enter the stock symbol they want to download. What was then needed is a way for the user to repeat this entry indefinitely until they had downloaded all of the symbols they wanted. To do this (with Kevin’s help) a loop was created to send the user back to the input section after the data had been pulled from Alpha Vantage. Alpha Vantage allows 200 calls/minute with their free plan, so there isn’t any problem with user input maxing out the API calls.
Kevin and I added some error recovery to this part to make sure that users don’t get kicked out of the program for doing something wrong. One step was to make sure that the StockSymbol variable was all uppercase so that the API could interpret it properly. This was fixed simply by adding .upper() formatting to the end of the input code.
It was also important to make sure if the user entered something that wasn’t a stock symbol, such as AM2, that the program didn’t halt when the API failed to access data. This was fixed by using try and except, if the program hits an error it prints out that the symbol does not exist and then lets the user input another symbol.
Finally, when the user is done entering symbols, they can enter “?” to continue on to produce a graph.
# Run until quit char entered
print('If you are done entering stock symbols enter "?" to continue to plotting')
while(1):
    # Pull data
    StockSymbol = input('Enter stock symbol: ').upper()
    ts = TimeSeries(key='XXXXXXXXXXXX', output_format='pandas')

    if(StockSymbol == '?'):
        break
    try:
        data, meta_data = ts.get_daily(symbol=StockSymbol, outputsize='full')
    except ValueError:
            print('Your entry was not a stock symbol')
            continue

    # Print csv in stocks/stock_name
    filepath = stock_path + '/' + StockSymbol +'.csv'
    data.to_csv(filepath)
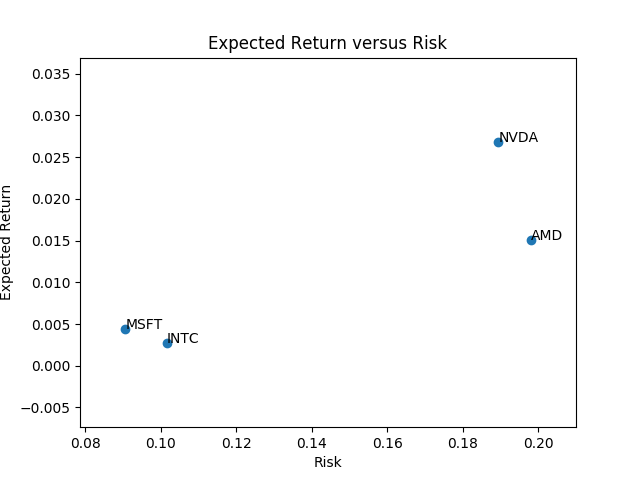
This final chunk of code takes all of the downloaded CSV files and first creates a data frame with the data from the different files. It then calculates the mean for each of the stocks (average return), as well as the standard deviation (the risk). The program then uses matplotlib.pyplot to create and save an image file with the plotted stocks.
df = pd.DataFrame()
for file in os.listdir(stock_path):
    # Derive the symbol from the filename (Change This)
    symbol = file.split('.')[0]
    # Load the data
    path = os.path.join(stock_path, file)
    df_stock = pd.read_csv(path)
    # Set the Date as index column
    df_stock['date'] = pd.to_datetime(df_stock['date'])
    df_stock = df_stock.set_index('date')
    # Resample based on months and compute the changes
    resampled = df_stock.resample('BM')
    monthly = resampled.apply(lambda x: x[-1])
    df[symbol] = monthly['1. open'].pct_change()
# Drop NaNs
df = df.dropna()
# Make the plot
x = df.std().tolist()
y = df.mean().tolist()
symbols = df.columns
# Scatterplot and annotation
plt.scatter(x, y)
for index, symbol in enumerate(symbols):
    plt.annotate(symbol, (x[index], y[index]))
# Title and axis
plt.xlabel('Risk')
plt.ylabel('Expected Return')
plt.title('Expected Return versus Risk')
# Save the plot
plt.savefig('expected_return_vs_risk.png')
# Let people know the location of their file
cwd = os.getcwd()
print('Your image file is located at', cwd)
When it’s all said and done, the user can navigate to the image’s location, and open an image that looks something like this:
Lucas Forrest
CPA
My interests include data analytics, machine learning, and oddball computer projects.